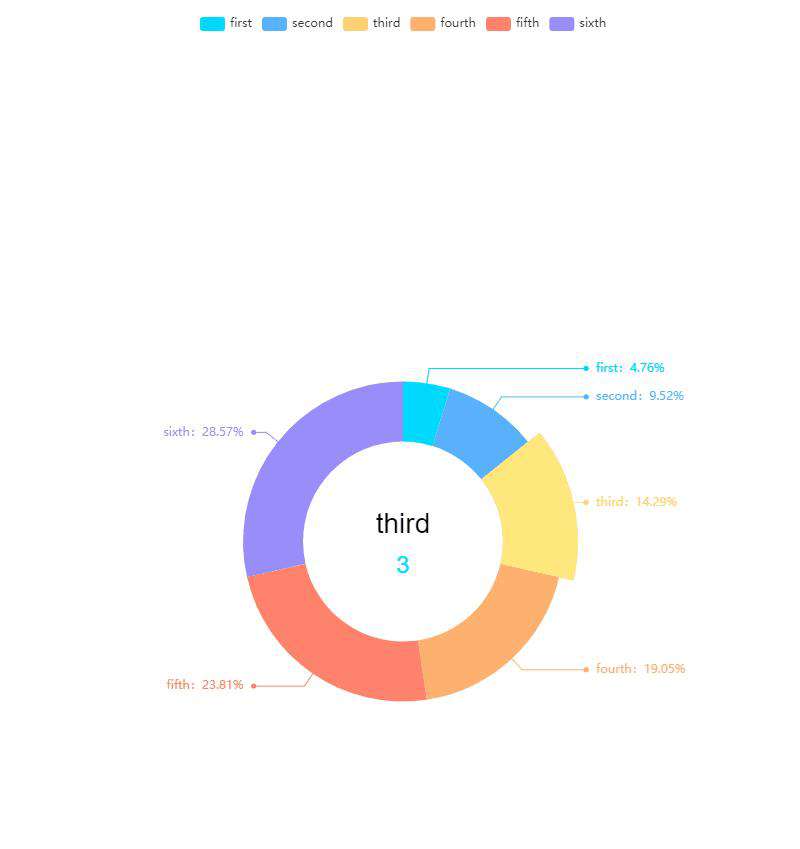
场景: echarts 饼图轮播高亮各项
效果图:
第一步:
明确,如何获取实例的配置,如何使得echarts 图表单项高亮/取消高亮
高亮,取消高亮对应echarts的Api
//echarts 生成实例后, 传入实例,通过` instance.getOption()` 获取实例各项参数

// 高亮
instance.dispatchAction({
    type: 'highlight',
    dataIndex: 0 // 数据项索引
})
// 取消高亮
instance.dispatchAction({
    type: 'downplay',
    dataIndex: 0 // 数据项索引
})
第二步:
各类数据
  let timer = null // 轮播定时器
  let currentIndex = -1 // 当前高亮第几个位置(注意不是数据项的dataIndex)
  let selectedLengend = null // 当前legend切换的数据信息
  let len = 0 //  当前可轮播的数据项列表长度
  let myEchart = null // echarts 实例
  let currDataList = null 当前可轮播的数据项列表
ps:
高亮索引从0开始, 每次高亮后,currentIndex+1, 会超出data数据项的长度,所以派发高亮/取消高亮的事件时候,需要 ``currentIndex = (currentIndex+1) % len`, len 是当前legend选中展示的数据项长度而不是全部的数据长度,后面会讲到。
第三步:
开启各项事件的监听
1.鼠标悬浮事件:instance.on('mouseover',e=>{.... })
说明:鼠标悬浮到图表首先得判断, 当前鼠标悬浮图项的dataIndex 是否正是当前轮播的 currentIndex
如果是则直接清除定时轮播,如果不是,则需要取消currentIndex的高亮效果,并且高亮当前回调中的项dataIndex,将当前currentItem 赋值为当前回调的数据项,并且调用highEvent(currentItem) (告诉外部数据变化)
2.鼠标移出事件:instance.on('mouseout',e=>{ ....})
说明: 承接上面移入,移出就比较简单, 直接重新开始走轮播定时器即可
3.图表切换显示与否事件:instance.on('legendselectchanged',e=>{... })
重点说明:如果忘了这一步,你的轮播图表就会出现明明取消展示了一些图,但是它们却还在轮播展示中,
所以监听这个legendselectchanged事件,就是为了,改变定时器当前可轮播项。该事件触发会返回当前图项目的展示与否信息,name作为key, false/true 作为value。详细细节看下面完整代码与注释。
4.点击事件: instance.on('click',e=>{ clickEvent(e) })
说明: 这里的点击事件单纯作为一个扩展方法,通过外部传入clickEvent,在此执行一次,将信息传达出去共给外部自定义其他交互。 tip:
1.timer应该在hooks 进入的时候,判断是否为空,不为空应该清除轮播定时器
2.在hook生命周期,onUnmounted 中应该清除轮播定时器
详细代码
1.PieEchart.vue
<template>
  <a-spin :spinning="loading">
    <div :ref="setRef" class="pie_echart"></div>
    <div class="markInfo">
      <div class="label">{{ current.name }}</div>
      <div class="value">{{ current.value }}</div>
    </div>
  </a-spin>
</template>

<script>
import { ref, onMounted, reactive, defineComponent } from 'vue'
import { pieGradient } from '/@/constant/echartsOption'
import useWinResize from '/@/hooks/useWinResize'
import useEchartSwipe from '/@/hooks/useEchartSwipe'
export default {
  name: 'PieEchart',
  props: {
    data: {
      type: Array,
      required: true
    },
    colorList: {
      type: Array,
      required: false
    }
  },
  setup(props, contexts) {
    const echartRef = ref(null)
    const setRef = el => {
      echartRef.value = el
    }
    const loading = ref(true)
    const { data, colorList } = props
    const init = async () => {
      loading.value = await new Promise((resolve, reject) => {
        setTimeout(() => {
          resolve(false)
        }, 220)
      })
    }
    onMounted(() => {
      init()
    })
    const clickEvent = e => {
      console.log(e)
    }
    const dataOption = pieGradient(data, colorList)
    const current = useEchartSwipe(echartRef, dataOption, 1800, clickEvent)
    return {
      setRef,
      loading,
      current
    }
  }
}
</script>

<style scoped lang="scss">
.pie_echart {
  width: 100%;
  height: calc(100vh - 270px);
}
.markInfo {
  position: absolute;
  top: 50%;
  left: 50%;
  text-align: center;
  transform: translate(-50%, -50%);
  .label {
    font-size: 28px;
    color: black;
  }
  .value {
    font-size: 24px;
    color: aqua;
  }
  @media screen and (max-width: 414px) {
    .label {
      font-size: 16px;
      color: black;
    }
    .value {
      font-size: 14px;
      color: aqua;
    }
  }
}
</style>
2.echartsOption
export const pieGradient = (data, colorList) => {
  const color = colorList ? colorList : ['#58D5FF', '#73ACFF', '#FDD56A', '#FDB36A', '#FD866A', '#9E87FF']
  const option = {
    legend: {
      show: true
    },
    tooltip: {
      trigger: 'item'
    },
    series: [
      {
        type: 'pie',
        center: ['50%', '50%'],
        radius: ['25%', '40%'],
        minAngle: 10,
        avoidLabelOverlap: true,
        hoverOffset: 15,
        itemStyle: {
          color: params => {
            return color[params.dataIndex]
          }
        },
        legendHoverLink: false, // 鼠标悬浮legend 高亮图表
        label: {
          show: true,
          position: 'outer',
          alignTo: 'labelLine',
          // ·圆点
          backgroundColor: 'auto', //圆点颜色,auto:映射的系列色
          height: 0,
          width: 0,
          lineHeight: 0,
          // height,width.lineHeight必须为0
          distanceToLabelLine: 0, //圆点到labelline距离
          borderRadius: 2.5,
          padding: [2.5, -2.5, 2.5, -2.5],

          /**
           * radius和padding为圆点大小,圆点半径为几radius和padding各项数值就为几
            如:圆点半径为1
            borderRadius: 1,
            padding: [1, -1, 1, -1]
           */
          formatter: '{a|{b}:}{b|{d}%}',
          rich: {
            a: {
              padding: [0, 0, 0, 10]
            },
            b: {
              padding: [0, 10, 0, 0]
            }
          }
        },
        data
      }
    ]
  }
  return option
}
3.useEchartSwipe
import { onMounted, onUnmounted, reactive } from 'vue'
import useWinResize from '/@/hooks/useWinResize'
import Echarts from 'echarts'
/**
 *
 * @param {*} dom  节点
 * @param {*} option 额外配置项
 * @param {*} interval 速度ms
 * @param {*} clickEvent 点击事件做什么
 */
export default function useEchartSwipe(dom = null, dataOption = null, interval = 2200, clickEvent = () => {}) {
  let timer = null
  let currentIndex = -1
  let selectedLengend = null
  let len = 0
  let myEchart = null
  let currDataList = null
  const currentItem = reactive({
    name: '',
    value: ''
  })
  const clearInstance = () => {
    myEchart.off('mouseover')
    myEchart.off('mouseout')
    myEchart.off('click')
    myEchart.clear()
    myEchart = null
  }
  /**
   * 初始化 echarts
   */
  const initPieEchart = () => {
    myEchart && clearInstance()
    myEchart = Echarts.init(dom.value)
    myEchart.setOption(dataOption)
  }
  /**
   *  auto swipe
   */
  const autoSwipe = () => {
    mainAction()
    timer && clearInterval(timer)
    timer = setInterval(mainAction, interval)
  }
  const highLight = index => {
    myEchart.dispatchAction({
      type: 'highlight',
      dataIndex: currDataList[index].dataIndex
    })
  }
  const downplay = index => {
    if (index === -1 || len === 0) return
    myEchart.dispatchAction({
      type: 'downplay',
      dataIndex: currDataList[index].dataIndex
    })
  }
  const mainAction = () => {
    const { series } = myEchart.getOption()
    currDataList = series[0].data.map((item, index) => {
      return {
        ...item,
        dataIndex: index
      }
    }) // 给每一项数据增加 dataIndex 后续 会用到
    if (selectedLengend) {
      // 如果存在 选中不选中图表的信息则需要重新过滤轮播
      currDataList = currDataList.filter(item => selectedLengend[item.name])
    }
    len = currDataList.length
    downplay(currentIndex % len)
    if (len > 0) {
      currentIndex = (currentIndex + 1) % len
      len === 1 ? clearInterval(timer) : highLight(currentIndex)
      currentItem.name = currDataList[currentIndex].name
      currentItem.value = currDataList[currentIndex].value
    } else {
      currentIndex = -1 // 取消所有数据展示 , 重置为-1
      currentItem.name = ''
      currentItem.value = ''
      timer && clearInterval(timer)
    }
  }
  /**
   * 挂载监听 mouseover, mousemove 事件
   */
  const initPieEvent = () => {
    myEchart.on('mouseover', e => {
      // 判断当前高亮是否是为悬浮的dataIndex
      const { dataIndex, name, value } = e
      if (currentIndex !== -1 && dataIndex !== currDataList[currentIndex].dataIndex) {
        // 取消轮播当前的高亮
        downplay(currentIndex)
      }
      // 改变当前项为 悬浮项
      currentItem.name = name
      currentItem.value = value
      // 下次轮播从当前高亮项开始downplay
      currentIndex = dataIndex
      // 直接清除定时器
      timer && clearInterval(timer)
    })
    myEchart.on('mouseout', () => {
      autoSwipe() // 鼠标离开,重新启动高亮
    })
    myEchart.on('legendselectchanged', e => {
      // 图表项,切换展示与否
      selectedLengend = e.selected
      // 重新开始轮播
      autoSwipe()
    })
    myEchart.on('click', e => {
      clickEvent(e) // 外部扩展事件
    })
  }
  const resizeEcharts = () => {
    myEchart && myEchart.resize()
  }
  useWinResize(resizeEcharts)

  onMounted(() => {
    setTimeout(() => {
      initPieEchart()
      initPieEvent()
      autoSwipe()
    }, 120)
  })

  onUnmounted(() => {
    timer && clearInterval(timer)
  })
  return currentItem
}
4.useWinResize
import { onMounted, onBeforeUnmount } from 'vue'

export default function useWinResize(Action = () => {}) {
  const fn = () => {
    /**
     * 延迟更新重绘等操作
     */
    setTimeout(Action, 120)
  }
  onMounted(() => {
    window.addEventListener('resize', fn, false)
  })
  onBeforeUnmount(() => {
    window.removeEventListener('resize', fn)
  })
  return null
}
常见问题FAQ
- 免费下载或者VIP会员专享资源能否直接商用?
- 本站所有资源版权均属于原作者所有,这里所提供资源均只能用于参考学习用,请勿直接商用。若由于商用引起版权纠纷,一切责任均由使用者承担。更多说明请参考 VIP介绍。
- 提示下载完但解压或打开不了?
- 找不到素材资源介绍文章里的示例图片?
- 模板不会安装或需要功能定制以及二次开发?


发表评论
还没有评论,快来抢沙发吧!