主要是总结大屏制作原理、echarts主题定制、echarts常用图绘制、在echarts中使用百度地图
效果

大屏的制作原理
1. 大屏就是要显示在大屏幕里的网页;
2. 大屏通常放在公共空间中展示数据;
3. 大屏的尺寸一般是1920*1080;
4. 大屏不用考虑浏览器的兼容性,只要谷歌能兼容就行;
5. 大屏的制作原理是在浏览器中,建立多个echarts容器,将不同的echarts图表放入其中;
大屏的自适应
www.jianshu.com/p/b2fd58d31…
实现过程
1.背景框架
 这部分代码略。
2.echarts主题定制
echarts.apache.org/zh/theme-bu… 点击左侧的下载主题按钮,即可下载js文件(或json文件) 以js方式为例:
<!--引入echarts-->
<script src="https://lib.baomitu.com/echarts/4.7.0/echarts.min.js"></script>
<!--引入样式-->
<script src="./js/walden.js"></script>
使用举例:(之后每一个图表都需要进行设置)
const chart = echarts.init(document.getElementById('chartL1'),'walden');
3.图表实现
3.1折线图
/*chartL1 - 折线图*/
{
    /*数据源*/
    const source=[
        ['年','2014', '2015', '2016', '2017', '2018', '2019', '2020'],
        ['收入',820, 932, 901, 934, 1290, 1330, 1520],
        ['支出',200, 632, 601, 634, 850, 1000, 1100]
    ];

    /*实例化echarts*/
    const chart = echarts.init(document.getElementById('chartL1'),'walden');
    /*配置项
    *   title
    *       text '西虹市人民收入增长情况'
    *   dataset 数据集
    *       source 数据源
    *   xAxis
    *       type
    *           category 类目轴
    *       boundaryGap 边界间隙
    *       axisLabel 坐标轴刻度标签的相关设置
    *           rotate 刻度标签旋转的角度
    *   yAxis
    *       type
    *           value 数值轴
    *   series 系列集合
    *       type 系列类型,如line
    *       seriesLayoutBy 行列映射
    *           column 应到 dataset 的列,默认
    *           row 应到 dataset 的行
    *
    * */
    const option = {
        title:{
            text:'西虹市人民收入增长情况',
            left:'center'
        },
        legend:{top:30},
        dataset:{
            source
        },
        xAxis:{
            type:'category'
        },
        yAxis:{
            type:'value',
        },
        series: [
            {type:'line',seriesLayoutBy:'row'},
            {type:'line',seriesLayoutBy:'row'},
        ]
    };
    /*显示图表*/
    chart.setOption(option);
}
3.2饼图
/*chartL2 - 饼图*/
{
    /*数据源*/
    const source=[
        {value:5000,name:'旅游'},
        {value:4500,name:'饮食'},
        {value:6500,name:'服装'},
        {value:3500,name:'电影'},
        {value:2500,name:'其它'}
    ];

    /*实例化echarts*/
    const chart = echarts.init(document.getElementById('chartL2'),'walden');
    /*配置项
    *   title
    *       text '西虹市人民衣食住行消费比'
    *   tooltip 提示
    *       formatter 提示信息格式化,如'{d}%'
    *   dataset 数据集
    *       source 数据源
    *   series 系列集合
    *       type 系列类型,如pie
    *       radius 半径
    *       roseType 南丁格尔图
    *       center 圆心位置
    * */
    const option = {
        title:{
            text:'西虹市人民衣食住行支出比',
            left:'center'
        },
        tooltip:{
            // formatter:'{d}%',
            formatter:({percent})=>{
                return Math.round(percent)+'%'
            },
            // formatter:'{b}%',
        },
        dataset:{source},
        series:{
            name:'支出比',
            type:'pie',
            center:['50%','58%'],
            roseType:'radius',
            radius:['40%','70%']
        }
    };

    /*显示图表*/
    chart.setOption(option);
}
3.3散点图
/*chartL3 - 散点图*/
{
    /*实例化echarts*/
    const chart = echarts.init(document.getElementById('chartL3'),'walden');

    /*维度*/
    const dimensions=['收入','年龄','人口','住址','时间'];

    /*配置项*/
    const option = {
        /*
        * title 标题
        *   text 主标题,如'西虹市人民收入和年龄关系'
        *   left 左对齐方式
        * */
        title:{
            text:'西虹市人民收入和年龄关系',
            left:'center'
        },
        tooltip:{},
        /*
        * 坐标轴
        *   type 坐标轴类型
        *       value  数值轴,适用于连续数据
        *   name 坐标轴名称
        * */
        xAxis:{
            type:'value'
        },
        yAxis:{
            type:'value'
        },
        /*
        * dataset 数据集
        *   dimensions 维度映射 []
        *       string,如 '年龄',等同于 {name: '年龄'}
        *   source 数据源
        * */
        dataset:{
            dimensions
        },

        /*
        * series系列集合
        *   type 图表类型
        *       scatter 散点图
        *   symbolSize 散点大小
        *   encode 编码映射
        *       x  x坐标系的维度映射,如1|'年龄'
        *       y  y坐标系的维度映射,如0|'收入'
        *       tooltip 提示映射,如[0, 1]
        *   itemStyle 项目样式
        *       opacity 项目透明度
        * */
        series:{
            type:'scatter',
            encode:{
                x:1,
                y:0,
                tooltip:[0,1,2,3,4]
            },
            symbolSize:3,
            itemStyle:{
                opacity:0.5
            }
        }

    };

    /*异步请求数据*/
    fetch('./lib/table.json')
        .then((res) => res.json())
        .then(data => {
            option.dataset.source=data
            chart.setOption(option)
        });

}
3.4雷达图
/*chartR1 - 雷达图*/
{
    /*数据*/
    const data=[
        {
            name : '预算分配',
            value : [43000, 45000, 42000, 45000, 40000, 49000],
        },
        {
            name : '实际开销',
            value : [30000, 34000, 55000, 35000, 32000, 31000],
        }
    ];
    /*
    * 雷达坐标系组件 radar
    *   indicator 雷达图的指示器集合 []
    *       name 指示器名称, 也就是标签内容
    *       min、max 数据区间,实际数据会在此区间内计算比值
    *       color 标签颜色
    *   shape 雷达形状
    *       polygon 多边形,默认
    *       circle 圆形
    *
    * */
    const indicator=[
        { name: '销售',min:0,max:60000},
        { name: '管理',min:0,max:60000},
        { name: '信息技术',min:0,max:60000},
        { name: '客服',min:0,max:60000},
        { name: '研发',min:0,max:60000},
        { name: '市场',min:0,max:60000}
    ];

    /*实例化echarts*/
    const chart = echarts.init(document.getElementById('chartR1'),'walden');

    /*配置项*/
    const option = {
        /*
        * title 标题
        *   text 主标题,如'西虹市财务开销'
        * */
        title:{
            text:'西虹市财务开销',
        },

        /*
        * tooltip 提示
        * */
        tooltip:{},


        /*legend 图例
        *   data 数据,如['预算分配', '实际开销']
        *   orient 排列方式
        *       vertical 竖排
        *       horizontal 横排,默认
        *   left 左边距,如0
        *   top 上边距,如32
        * */
        legend:{
            data:['预算分配', '实际开销'],
            left:'left',
            top:30,
            orient:'vertical'
        },


        /*
        * 雷达坐标系组件 radar
        *   indicator[] 雷达图的指示器,定义雷达的轴
        * */
        radar:{
          indicator
        },

        /*
        * series系列集合
        *   type 图表类型
        *       radar 雷达图
        *   data 数据
        * */
        series:{
            type:'radar',
            data
        }
    };
    // 使用刚指定的配置项和数据显示图表。
    chart.setOption(option);
}
3.5柱状图
/*chartR2 - 柱状图*/
{
    /*数据源*/
    const source=[
        ['时间','小麦','玉米','高粱'],
        [2017,  1000,  800,  900],
        [2018,  500,   650,  800],
        [2019,  800,   900,  1200],
    ];

    /*实例化echarts*/
    const chart = echarts.init(document.getElementById('chartR2'),'walden');

    /*配置项*/
    const option = {
        /*
        * title 标题
        *   text 主标题,如'西虹市农作物收成'
        * */
        title:{
            text:'西虹市农作物收成',
            left:'center'
        },
        tooltip:{},
        legend:{
            top:30
        },
        grid:{
            top:72,
            bottom:28
        },
        /*
        * dataset 数据集
        *   source 数据源
        * */
        dataset:{source},

        /*  xAxis
        *       type
        *           category 类目轴
        *   yAxis
        *       type
        *           value 数值轴
        */
        xAxis:{
            type:'category'
        },
        yAxis:{
            type:'value'
        },

        /*
        * series系列集合
        *   type 图表类型
        *       bar 柱状图
        *   color 颜色
        *       image 图像源
        *       repeat 图像的重复方式,如repeat
        * */
        series:[
            {id:'xm',type:'bar'},
            {id:'ym',type:'bar'},
            {id:'gl',type:'bar'},
        ]

    };
    chart.setOption(option);

    /*图像源*/
    //小麦
    const imgXm=new Image();
    imgXm.src='./images/xm.jpg';
    //玉米
    const imgYm=new Image();
    imgYm.src='./images/ym.jpg';
    //高粱
    const imgGl=new Image();
    imgGl.src='./images/gl.jpg';

    //当所有图片都加载成功后再绘图
    Promise.all([imgPro(imgXm),imgPro(imgYm),imgPro(imgGl)]).then(()=>{
        //绘图
        chart.setOption({
            series:[
                {
                    id:'xm',
                    color:{
                        image:imgXm
                    }
                },
                {
                    id:'ym',
                    color:{
                        image:imgYm
                    }
                },
                {
                    id:'gl',
                    color:{
                        image:imgGl
                    }
                },
            ]
        });
    });
    //建立Promise 对象,指定img 加载成功后,执行resolve
    function imgPro(img){
        return new Promise((resolve)=>{
            img.onload=function(){
                resolve(img);
            }
        });
    }

}
3.6地图(map)
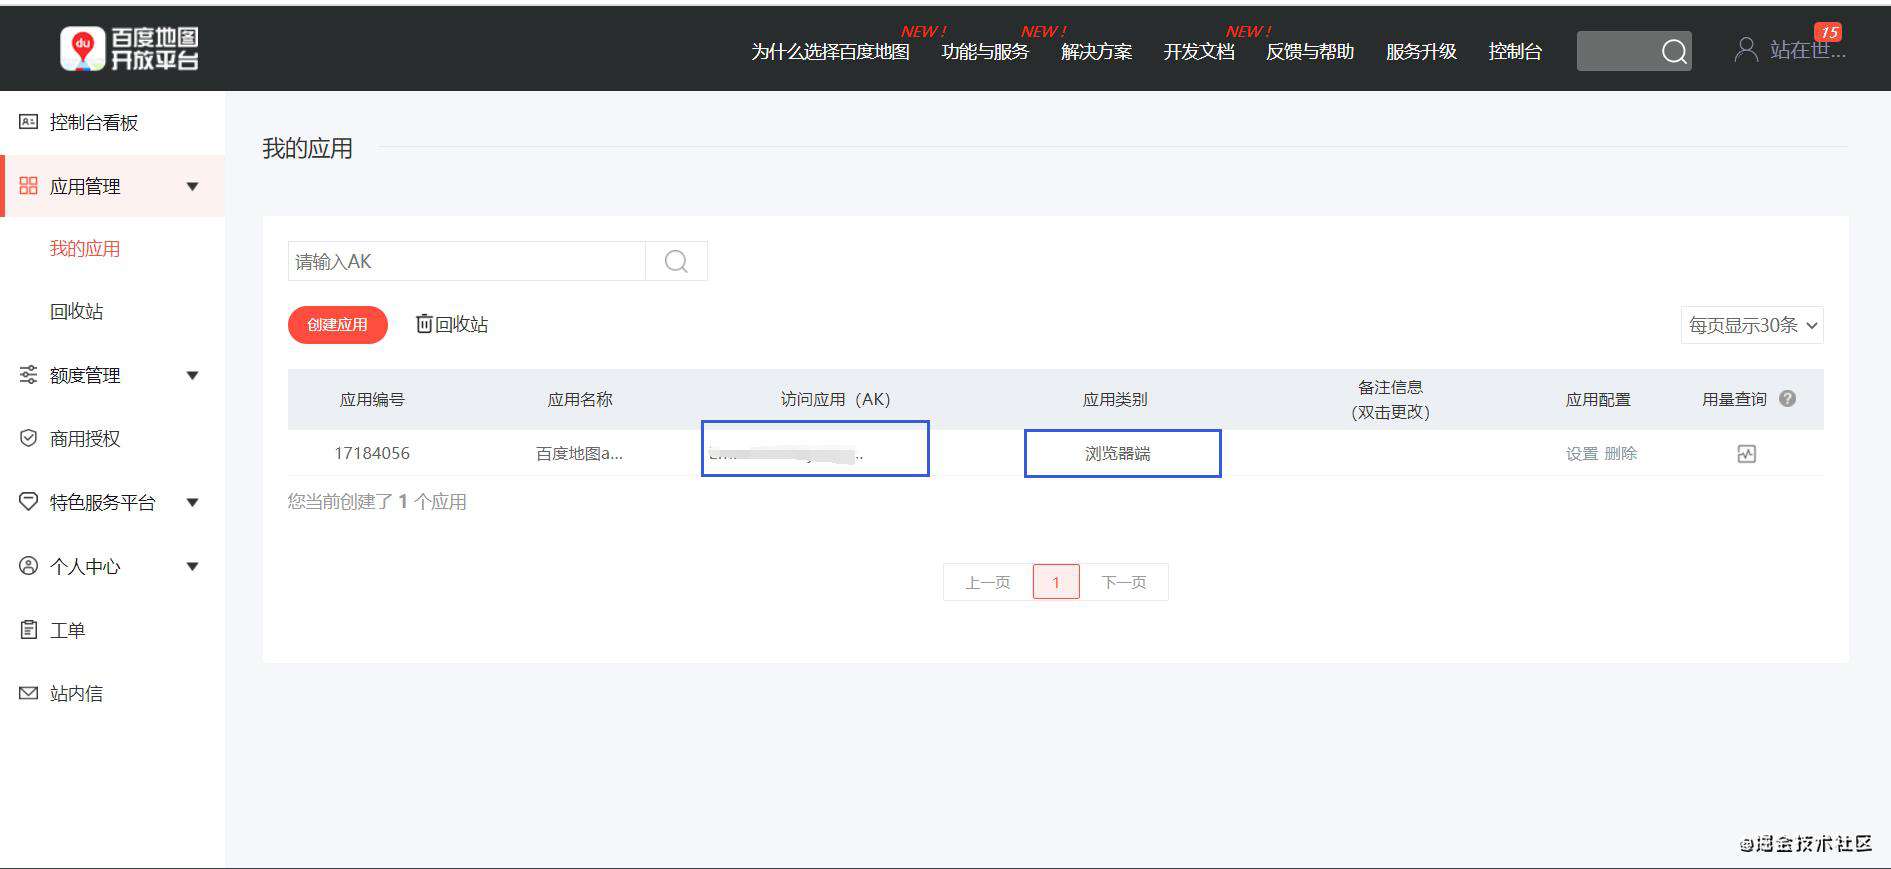
需要先引入百度地图api和bmap组件
控制台->应用管理->我的应用
<!--引入百度地图api-->
<script src="https://api.map.baidu.com/api?v=3.0&ak=<你的ak>"></script>
<!--引入bmap 组件-->
<script src="https://cdn.jsdelivr.net/npm/echarts/dist/extension/bmap.min.js"></script>
/*chartR3 - 百度地图*/
{
    const chart = echarts.init(document.getElementById('chartR3'),'walden');

    const option = {
        /*
        * title 标题
        *   text 主标题,如'西虹市在哪里'
        *   left 左对齐方式
        *   top 上边距,如12
        * */
        title:{
            text:'西虹市的空气质量',
            left:'center',
            top:12,
        },
        /*
        * bmap 百度地图
        *   center[经度,纬度] 地图中心点位,如[121.48, 31.22]
        *   zoom 缩放级别,如6
        *   roam 是否可以拖拽缩放
        *   mapStyleV2 地图样式
        *       styleId 样式id
        *		在百度地图个性化编辑器((http://lbsyun.baidu.com/customv2/editor/c7162446b3c9506b18bdb9478cb2b0d0))发布样式后的id
        * */
        bmap:{
            center:[121.48, 31.22],
            zoom:6,
            roam:true,
            //mapStyleV2: {
             //   styleId:<你的styleId>
            //}
        },

        /*系列列表
        *   type 系列类型
        *       scatter 散点图
        *       effectScatter 特效散点图
        *   coordinateSystem 坐标类型,bmap
        *   data 数据
        *   symbolSize 尺寸
        * */
        series : [
            {id:'s1',type:'scatter',coordinateSystem:'bmap'},
            {id:'s2',type:'effectScatter',coordinateSystem:'bmap'},
        ]
    };
    chart.setOption(option);

    /*获取空气质量质量数据*/
    fetch('./lib/pm.json')
        .then((res) => res.json())
        .then(data => {
            const len=data.length
            const data2=data.splice(len-5,len)
            //绘图
            chart.setOption({
                series:[
                    {
                        id:'s1',
                        data,
                        symbolSize:(param)=>{
                            return param[2]/10
                        }
                    },
                    {
                        id:'s2',
                        data:data2,
                        symbolSize:(param)=>{
                            return param[2]/10
                        }
                    },
                ]
            })
        });


    /*获取百度地图的实例 chart.getModel().getComponent('bmap').getBMap()*/

}
3.7地图(geo)
注册中国地图
中国地图数据地址:
raw.githubusercontent.com/yezongyang/…
<!--中国地图-->
<script src='./js/China.js'></script>
china.js文件
(function (root, factory) {
    if (typeof define === 'function' && define.amd) {
        // AMD. Register as an anonymous module.
        define(['exports', 'echarts'], factory);
    } else if (typeof exports === 'object' && typeof exports.nodeName !== 'string') {
        // CommonJS
        factory(exports, require('echarts'));
    } else {
        // Browser globals
        factory({}, root.echarts);
    }
}(this, function (exports, echarts) {
    var log = function (msg) {
        if (typeof console !== 'undefined') {
            console && console.error && console.error(msg);
        }
    }
    if (!echarts) {
        log('ECharts is not Loaded');
        return;
    }
    if (!echarts.registerMap) {
        log('ECharts Map is not loaded')
        return;
    }
    echarts.registerMap('china', <访问数据地址获得的对象>);
}));
绘制地图:
/*chartC - echarts地图*/
{
    const chart = echarts.init(document.getElementById('chartC'),'walden');

    /*配置项*/
    const option = {
        /*
        * title 标题
        *   text 主标题,如'西虹市不同地区的平均收入'
        *   textStyle 主题样式
        *   left 左对齐方式
        *   top 上边距,如12
        * */
        title:{
            text:'西虹市不同地区的平均收入',
            textStyle:{
                fontSize:24
            },
            left:'center',
            top:32,
        },

        /*
        * tooltip 提示
        *   backgroundColor 背景色,如'rgba(2,177,236,0.6)'
        * */
        tooltip:{},

        /*
        *地理坐标系组件 geo
        *   map 地图名称,如'china'
        *   zoom 缩放比例,如1
        *   roam 是否开启鼠标缩放和平移漫游
        *       scale 缩放
        *       move 平移
        *       true 都开启
        *   itemStyle 地图区样式
        *       areaColor 地图区域的颜色,如 rgba(0,29,132,0.8)
        *       borderColor 图形的描边颜色,如 #02c0ff
        *   emphasis 高亮状态下的多边形和标签样式
        *       itemStyle {} 项目样式
        *           shadowColor 投影颜色
        *
        * */
        geo:{
            map:'china',
            zoom:1,
            roam:true,
            itemStyle:{
                areaColor:'rgba(0,29,132,0.8)',
                borderColor:'#02c0ff'
            },
            emphasis:{
                itemStyle:{
                    shadowColor:'#000',
                    shadowOffsetY:30,
                    shadowBlur:30
                }
            }
        },


        /*
        * series系列集合
        *   name 名称,如'旅游人数'
        *   type 图表类型
        *       scatter 散点图
        *   coordinateSystem 坐标类型,如'geo'
        *   data 数据
        *   symbolSize 散点大小,可为函数(p)=>{return p[2]}
        *   encode 编码映射
        *       x  x坐标系的维度映射,如'收入'
        *       y  y坐标系的维度映射,如'年龄'
        *       tooltip 提示映射,如[0, 1, 2, 3, 4]
        *   itemStyle 项目样式
        *       color 项目颜色,如'rgba(255,255,255,0.6)'
        *   emphasis 高亮状态
        *       itemStyle 项目样式
        *           color 颜色,如'yellow'
        * */
        series:[
            {
                id:1,
                type:'scatter',
                coordinateSystem:'geo',
                symbolSize:(param)=>{
                    return param[2]/15
                },
                emphasis:{
                    itemStyle:{
                        color:'yellow'
                    },
                }
            }
        ]

    };
    chart.setOption(option);

    fetch('./lib/income.json')//收入数据
        .then((res) => res.json())
        .then(data => {
            dataLen = data.length;
            chart.setOption({
                series:[
                    {
                        id:1,
                        data
                    }
                ]
            })
            setInterval(anim, 1000);
        });


    let curInd = 0;
    let dataLen = null;

    function anim() {
        /*取消之前高亮的图形
        *   type 触发的行为类型,见action
        *   seriesIndex 系列索引,用于寻找系列列表中的某个系列
        *   dataIndex 数据所有,用于寻找系列中的某个元素
        * */
        chart.dispatchAction({
            type: 'downplay',
            seriesIndex: 0,
            dataIndex: curInd
        });
        /*当前索引递增,不能超过系列元素的总数*/
        curInd = (curInd + 1) % dataLen;

        /*高亮当前图形*/
        chart.dispatchAction({
            type: 'highlight',
            seriesIndex: 0,
            dataIndex: curInd
        });
        /*显示 tooltip*/
        chart.dispatchAction({
            type: 'showTip',
            seriesIndex: 0,
            dataIndex: curInd
        });
    }
}
常见问题FAQ
- 免费下载或者VIP会员专享资源能否直接商用?
- 本站所有资源版权均属于原作者所有,这里所提供资源均只能用于参考学习用,请勿直接商用。若由于商用引起版权纠纷,一切责任均由使用者承担。更多说明请参考 VIP介绍。
- 提示下载完但解压或打开不了?
- 找不到素材资源介绍文章里的示例图片?
- 模板不会安装或需要功能定制以及二次开发?


发表评论
还没有评论,快来抢沙发吧!