canvas 图形绘制
以下实现均在 GitHub 仓库 ? electron-screenshot,demo
箭头绘制
基本上就是三角函数计算,如图所示:
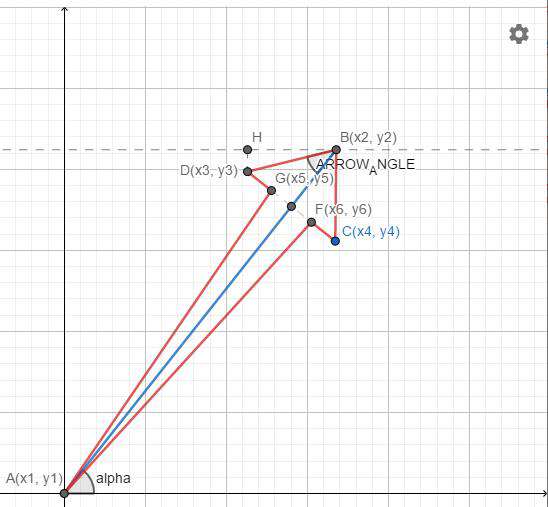
/** PI/6 */
const ARROW_ANGLE = Math.PI / 6;

export function drawArrow(
  ctx: CanvasRenderingContext2D,
  startPoint: Point,
  endPoint: Point,
  width: number,
  fillStyle: CanvasFillStrokeStyles['fillStyle']
) {
  const [x1, y1] = startPoint;
  const [x2, y2] = endPoint;
  const alpha = Math.atan((y1 - y2) / (x1 - x2));
  /** EA点重叠时BD长度 */
  const minArrowHeight = Math.abs(
    (x2 - x1) / (Math.cos(alpha) * Math.cos(ARROW_ANGLE))
  );
  /** BD实际长度 */
  const arrowHeight = Math.min(minArrowHeight, 6 + width * 2);
  const d = x2 < x1 ? -1 : 1;
  const [x3, y3] = [
    x2 - Math.cos(alpha - ARROW_ANGLE) * arrowHeight * d,
    y2 - Math.sin(alpha - ARROW_ANGLE) * arrowHeight * d,
  ];
  const [x4, y4] = [
    x2 - Math.cos(alpha + ARROW_ANGLE) * arrowHeight * d,
    y2 - Math.sin(alpha + ARROW_ANGLE) * arrowHeight * d,
  ];
  const [xa, ya] = [(x4 - x3) / 3, (y4 - y3) / 3];
  const [x5, y5] = [x3 + xa, y3 + ya];
  const [x6, y6] = [x4 - xa, y4 - ya];
  const paths: Array<Point> = [
    [x1, y1],
    [x5, y5],
    [x3, y3],
    [x2, y2],
    [x4, y4],
    [x6, y6],
  ];
  ctx.beginPath();
  ctx.moveTo(x1, y1);
  paths.slice(1).forEach((point) => ctx.lineTo(...point));
  ctx.closePath();
  ctx.fillStyle = fillStyle;
  ctx.fill();
}
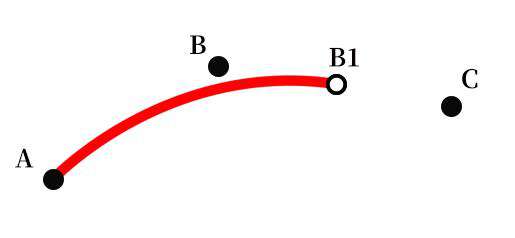
笔刷效果
如果只是多个点以直线连接,当采集点不够密集,则会出现线条不平滑的现象,如下图所示:
用过 Photoshop 的我们都知道贝塞尔曲线的厉害,这里我们采用 quadraticCurveTo 来绘制贝塞尔曲线以达到实现平滑线条的目的。
绘制一条二次贝塞尔曲线,需要 起始点、控制点和终点。当只有两个点时直接连接,三个点以上则每次取三个点,第二个点为 控制点,第二个点和第三个点的中点为终点绘制;然后以这一步的控制点和中点以及下一个点来重复这个步骤,直到只剩最后一点,直接连接。
export function drawCurve(
  ctx: CanvasRenderingContext2D,
  path: Array<Point>,
  lineWidth: number,
  strokeStyle: CanvasFillStrokeStyles['strokeStyle']
) {
  if (path.length < 2) return;
  ctx.lineWidth = lineWidth;
  ctx.strokeStyle = strokeStyle;
  ctx.lineCap = 'round';
  ctx.beginPath();
  let startPoint = path[0];
  ctx.moveTo(...startPoint);
  for (let i = 1; i < path.length - 1; i++) {
    /** controlPoint, nextPoint */
    const [[cx, cy], [nx, ny]] = path.slice(i, i + 2);
    /** endPoint */
    const [ex, ey] = [cx + (nx - cx) / 2, cy + (ny - cy) / 2];
    ctx.quadraticCurveTo(cx, cy, ex, ey);
    startPoint = [ex, ey];
  }
  ctx.lineTo(...path.slice(-1)[0]);
  ctx.stroke();
  ctx.closePath();
}
椭圆绘制
这儿我们绘制一个矩形的内切椭圆,矩形由两对角的点(startPoint/endPoint)控制。由于 canvas 只有绘制正圆的 arc() 方法,所以得先对 canvas 进行缩放。
export function drawEllipse(
  ctx: CanvasRenderingContext2D,
  startPoint: Point,
  endPoint: Point,
  lineWidth: number,
  strokeStyle: CanvasFillStrokeStyles['strokeStyle']
) {
  const [[x1, y1], [x2, y2]] = [startPoint, endPoint];
  const [r1, r2] = [x1 - x2, y1 - y2].map((n) => Math.abs(n / 2));
  const [x0, y0] = [(x1 + x2) / 2, (y1 + y2) / 2];
  const r = Math.max(r1, r2);
  const [rx, ry] = [r1 / r, r2 / r];
  ctx.save();
  ctx.scale(rx, ry);
  ctx.beginPath();
  ctx.arc(x0 / rx, y0 / ry, r, 0, 2 * Math.PI);
  ctx.closePath();
  ctx.restore();
  ctx.lineWidth = lineWidth;
  ctx.strokeStyle = strokeStyle;
  ctx.stroke();
}
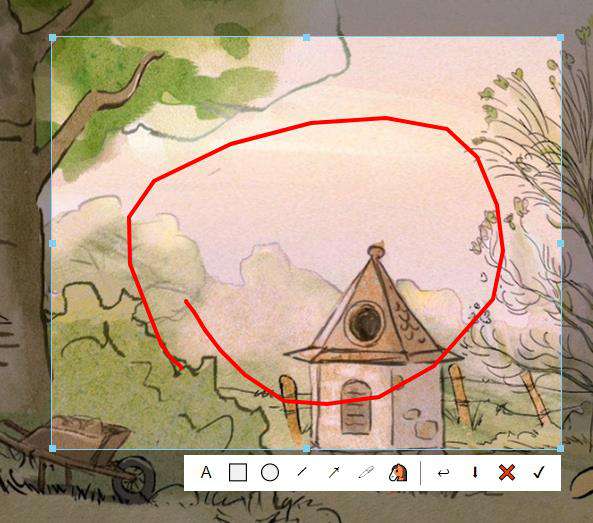
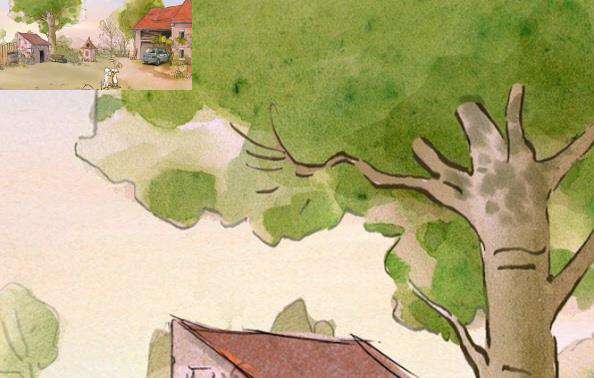
图片马赛克
基本思路就是将画布划分为一个棋盘,计算每个棋盘内的颜色均值,将这个棋盘所有的像素颜色设置为这个均值。
首先计算每个马赛克方块的像素颜色:
/** size: 马赛克方块大小 */
export function createMosaicData(ctx: CanvasRenderingContext2D, size: number) {
  const { width, height } = ctx.canvas;
  // 获取横纵方格数量
  const [wl, hl] = [Math.ceil(width / size), Math.ceil(height / size)];
  // 画布原始像素数据
  const data = ctx.getImageData(0, 0, width, height).data;
  // 生成一个新的 wl * hl 像素数据
  const md = new Uint8ClampedArray(wl * hl * 4);
  for (let i = 0; i < wl * hl; i++) {
    const sy = Math.floor(i / wl);
    const sx = i - sy * wl;
    let [sumR, sumG, sumB, total] = [0, 0, 0, 0];
    // 计算原始画布中每个方格内颜色的均值
    for (let y = sy * size; y < Math.min((sy + 1) * size, height); y++) {
      const stratY = y * width;
      for (let x = sx * size; x < Math.min((sx + 1) * size, width); x++) {
        const sIndex = (stratY + x) * 4;
        (sumR += data[sIndex]),
          (sumG += data[sIndex + 1]),
          (sumB += data[sIndex + 2]),
          total++;
      }
    }
    [md[i * 4], md[i * 4 + 1], md[i * 4 + 2], md[i * 4 + 3]] = [
      sumR / total,
      sumG / total,
      sumB / total,
      255,
    ];
  }
  return md;
}
如果将 size 设置为 10,可以得到一张画布缩小 10 倍后的像素数据:
const size = 10;
const ctx = canvas.getContext('2d');
const { width, height } = canvas;
const [wl, hl] = [Math.ceil(width / size), Math.ceil(height / size)];
ctx.putImageData(new ImageData(createMosaicData(ctx, size), wl, hl), 0, 0);
最后我们只需要将缩放后的像素信息等比例的绘制到画布上即可得到原画布的马赛克效果画布:
export function mosaicCnavas(ctx: CanvasRenderingContext2D, size: number) {
  const { width, height } = ctx.canvas;
  const md = createMosaicData(ctx, size);
  const [wl, hl] = [Math.ceil(width / size), Math.ceil(height / size)];
  const newData = new Uint8ClampedArray(width * height * 4);
  for (let y = 0; y < hl; y++) {
    const [startY, endY] = [y * size, Math.min((y + 1) * size, height)];
    for (let x = 0; x < wl; x++) {
      const [startX, endX] = [x * size, Math.min((x + 1) * size, width)];
      const index = (y * wl + x) * 4;
      const [R, G, B, A] = [md[index], md[index + 1], md[index + 2], 255];
      // 将方块内的所有点均设置为平均颜色
      for (let y0 = startY; y0 < endY; y0++) {
        for (let x0 = startX; x0 < endX; x0++) {
          const nIndex = (y0 * width + x0) * 4;
          (newData[nIndex] = R),
            (newData[nIndex + 1] = G),
            (newData[nIndex + 2] = B),
            (newData[nIndex + 3] = A);
        }
      }
    }
  }
  ctx.putImageData(new ImageData(newData, width, height), 0, 0);
}
如果需要实现部分区域的马赛克化,则需要计算出需要马赛克化的区域。下面就通过笔刷绘制来说明。
首先我们会得到一个笔刷路径path以及笔刷宽度brushWidth,这里对所有路径点以半径r=brushWidth/2的圆形区域组成的区域进行马赛克化。
const createDrawMosaicLayerData = (
  width: number,
  height: number,
  path: Array<Point>,
  r: number
) =>
  path.reduce((data, [x0, y0]) => {
    const [startX, endX] = [Math.max(0, x0 - r), Math.min(x0 + r, width)];
    const [startY, endY] = [Math.max(0, y0 - r), Math.min(y0 + r, height)];
    for (let y = startY; y < endY; y++) {
      for (let x = startX; x < endX; x++) {
        if ((x - x0) ** 2 + (y - y0) ** 2 < r ** 2) {
          data[y * width + x] = true;
        }
      }
    }
    return data;
  }, <Array<boolean>>Array(width * height).fill(false));
通过以上方法得到一个长度为 width * height 的布尔数组,用于表示画布上的每个点是否需要处理。
export function drawMosaic(
  ctx: CanvasRenderingContext2D,
  path: Array<Point>,
  size: number,
  brushWidth: number,
  data: Uint8ClampedArray
) {
  const { height, width } = ctx.canvas;
  const drawData = createDrawMosaicLayerData(
    width,
    height,
    path,
    brushWidth / 2
  );
  const [wl, hl] = [Math.ceil(width / size), Math.ceil(height / size)];
  /** 元素图片像素数据 */
  const originalData = ctx.getImageData(0, 0, width, height).data;
  /** 待处理像素数据 */
  const newData = new Uint8ClampedArray(width * height * 4);
  for (let y = 0; y < hl; y++) {
    const [startY, endY] = [y * size, Math.min((y + 1) * size, height)];
    for (let x = 0; x < wl; x++) {
      const [startX, endX] = [x * size, Math.min((x + 1) * size, width)];
      const index = (y * wl + x) * 4;
      const [R, G, B, A] = [data[index], data[index + 1], data[index + 2], 255];
      for (let y0 = startY; y0 < endY; y0++) {
        for (let x0 = startX; x0 < endX; x0++) {
          const dIndex = y0 * width + x0;
          const nIndex = dIndex * 4;
          // 方法同 mosaicCnavas,区别为通过 drawData[dIndex] 来判断赋予原始RGBA值还是马赛克化后的RGB值
          if (drawData[dIndex]) {
            newData[nIndex] = R;
            newData[nIndex + 1] = G;
            newData[nIndex + 2] = B;
            newData[nIndex + 3] = A;
          } else {
            newData[nIndex] = originalData[nIndex];
            newData[nIndex + 1] = originalData[nIndex + 1];
            newData[nIndex + 2] = originalData[nIndex + 2];
            newData[nIndex + 3] = originalData[nIndex + 3];
          }
        }
      }
    }
  }
  ctx.putImageData(new ImageData(newData, width, height), 0, 0);
}
TODO: 上述绘制区域的计算依然存在不足,比如路径点之间距离过大时(>2r)会有绘制不连贯的问题,解决方向依然是贝塞尔曲线 ?
参考文档:
- canvas 进阶之如何画出平滑的曲线
- MDN CanvasRenderingContext2D.quadraticCurveTo()
- MDN ImageData
- MDN CanvasRenderingContext2D.putImageData
- 现代 JavaScript 教程 - ArrayBuffer,二进制数组
原文连接:https://github.com/canvascat/note/issues/15
常见问题FAQ
- 免费下载或者VIP会员专享资源能否直接商用?
- 本站所有资源版权均属于原作者所有,这里所提供资源均只能用于参考学习用,请勿直接商用。若由于商用引起版权纠纷,一切责任均由使用者承担。更多说明请参考 VIP介绍。
- 提示下载完但解压或打开不了?
- 找不到素材资源介绍文章里的示例图片?
- 模板不会安装或需要功能定制以及二次开发?


发表评论
还没有评论,快来抢沙发吧!